EU ETS Calculator
Timeline
May 2023, Research
June 2023, Design
August 2023, Development
November 2023, Beta Testing
January 2024, Shipped
My Role
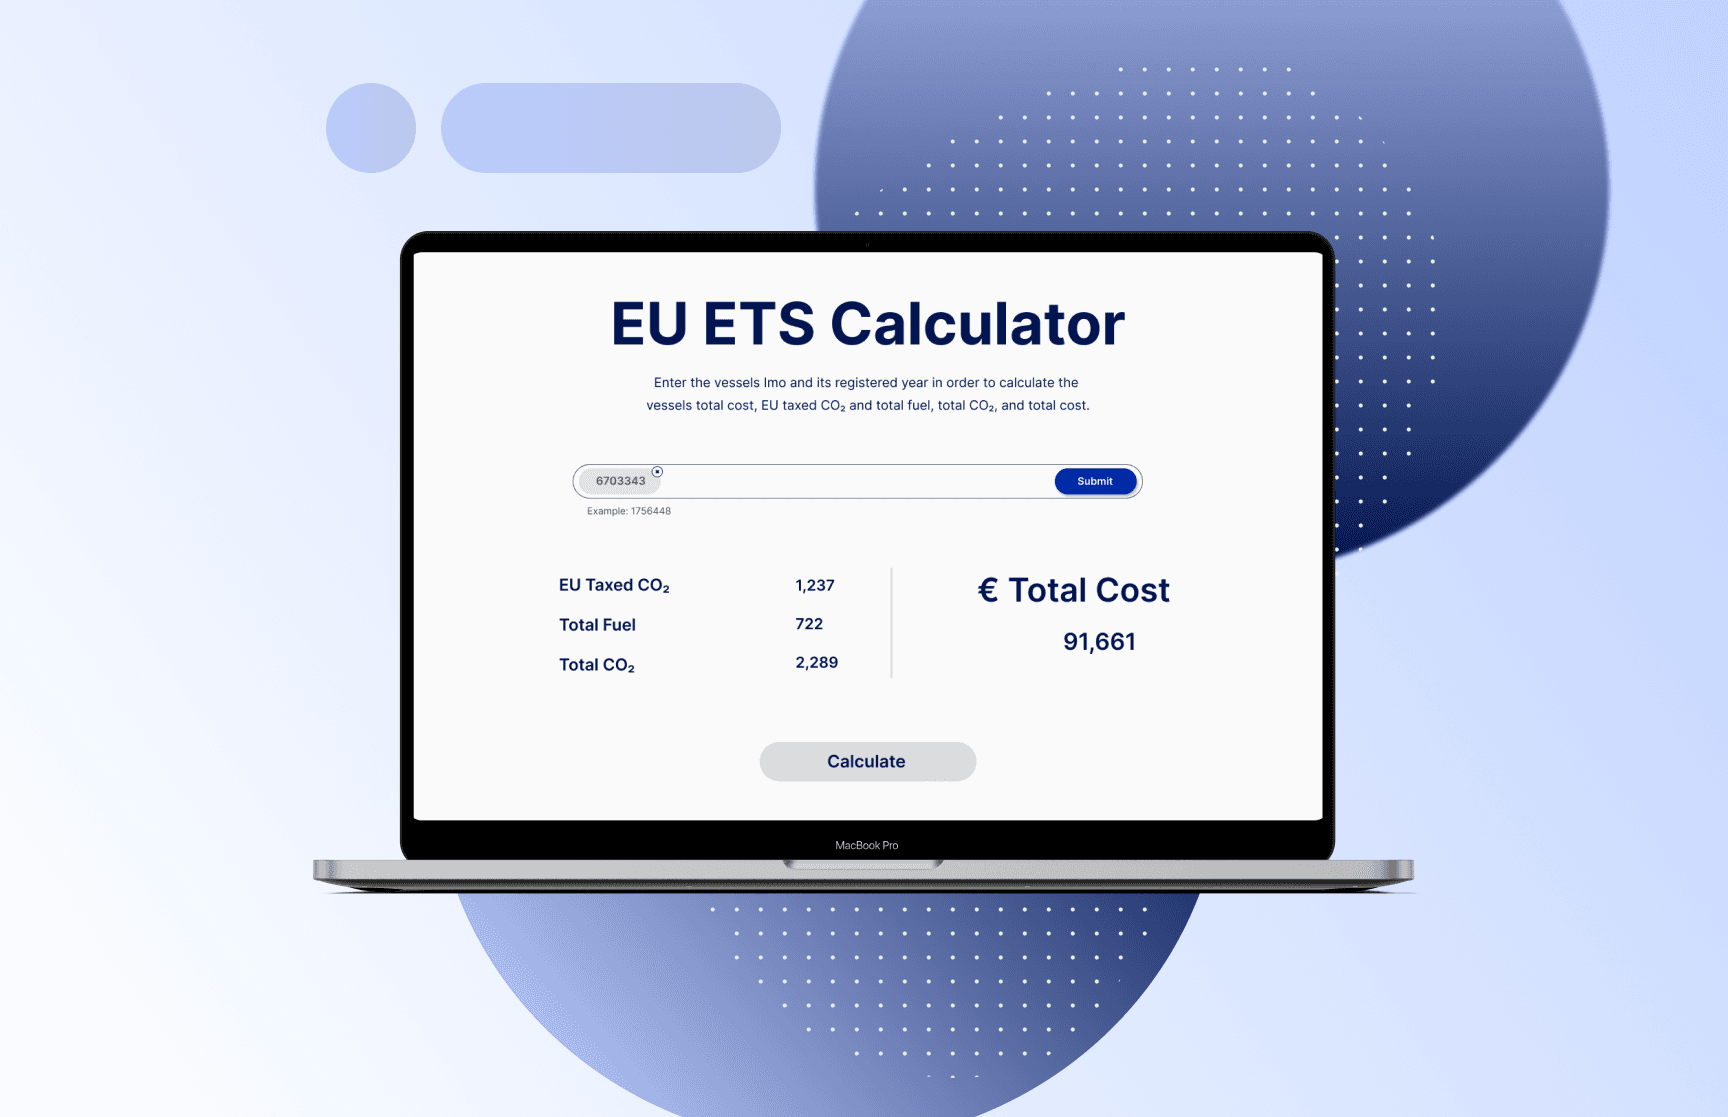
Collaborated with an engineer to build a maritime compliance analytics tool using Dash. Contributed to the app’s design and prototyping, shaping the user experience and interface architecture. The platform enables ship owners to calculate annual compliance costs, total CO₂ emissions, taxable CO₂, and total fuel consumption.
Project Purpose and Goal
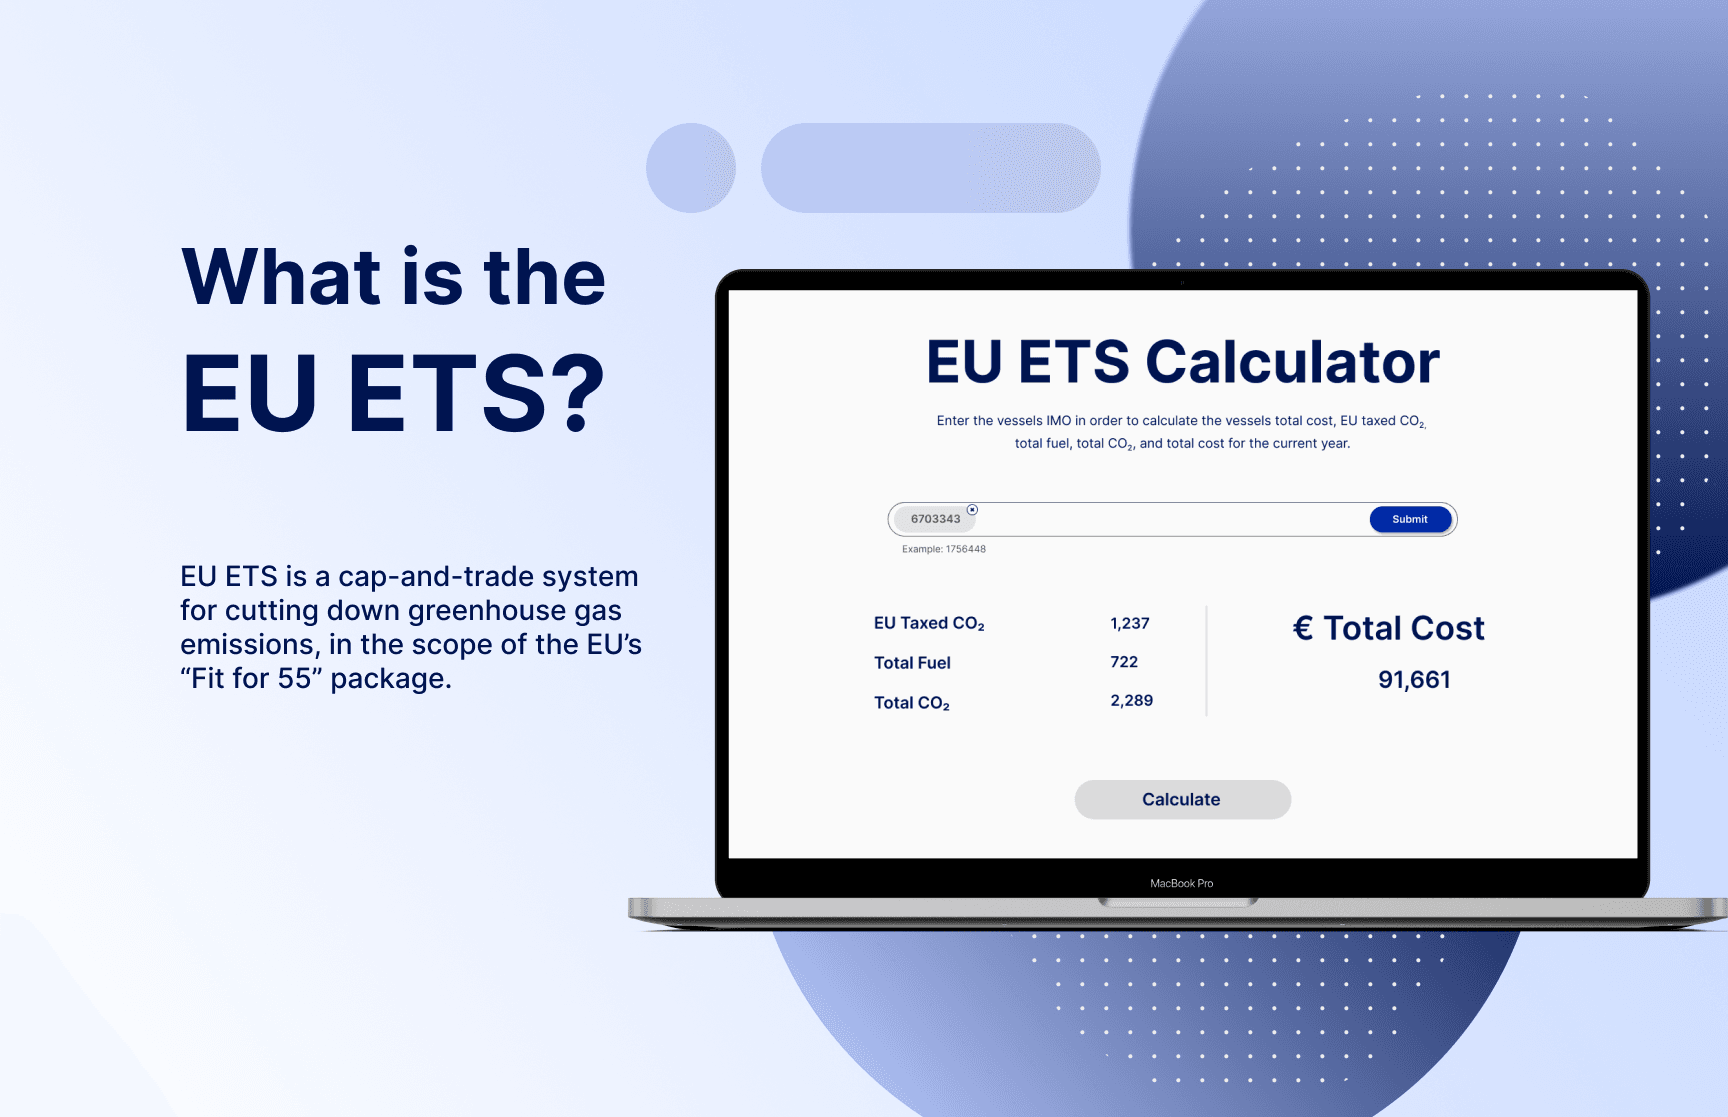
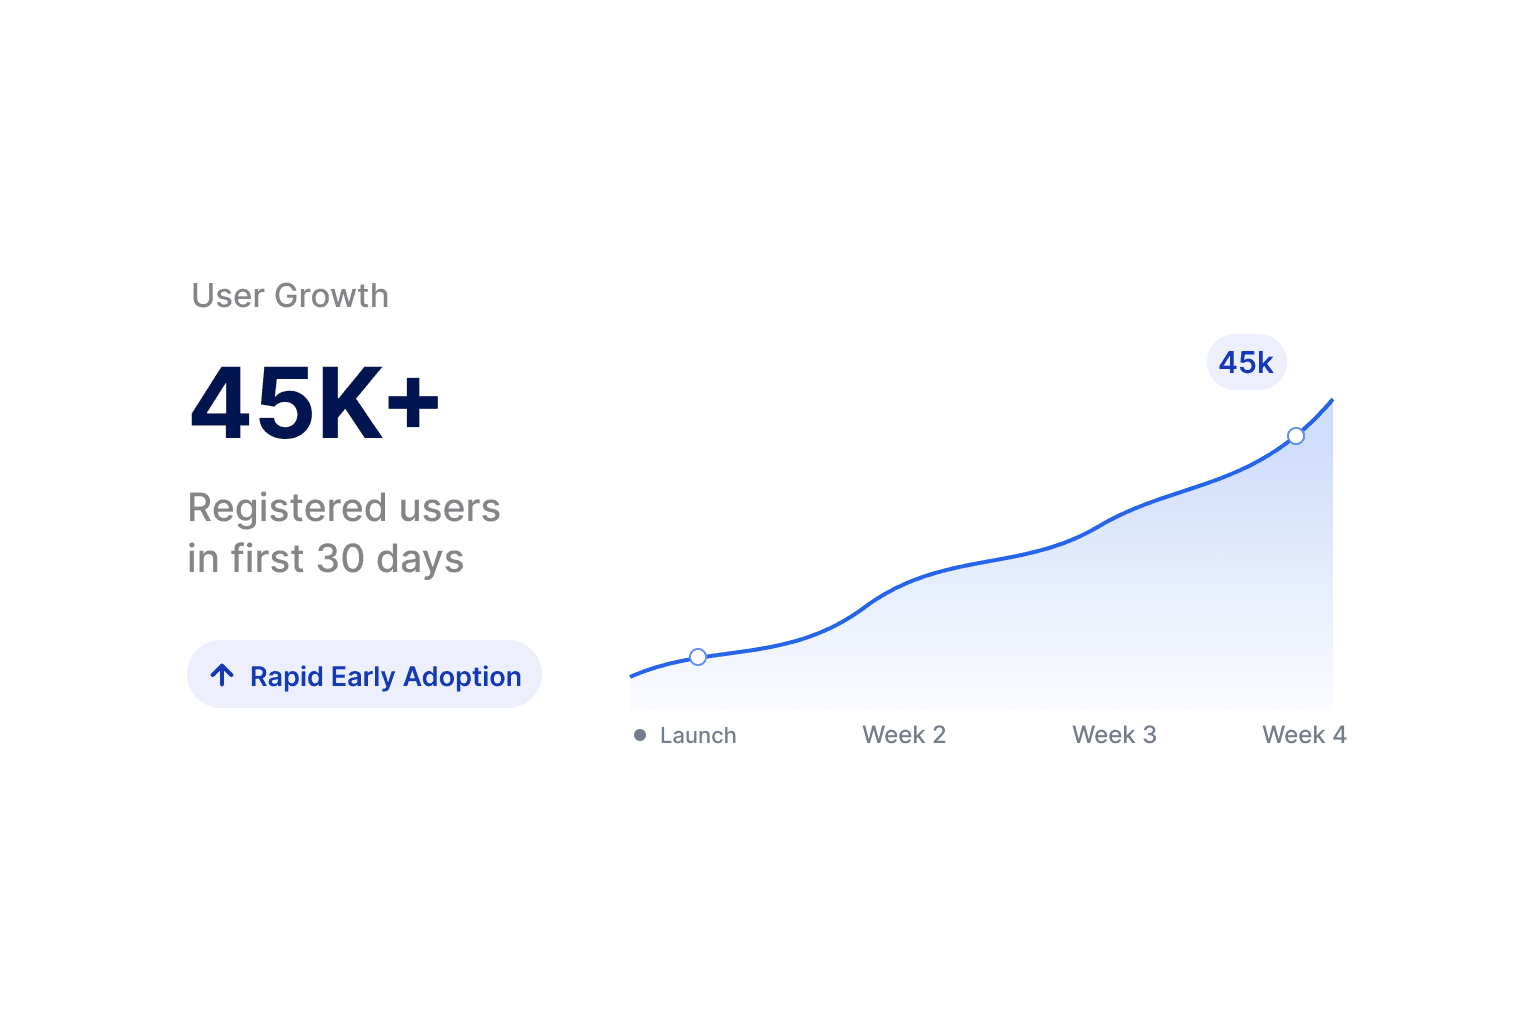
The purpose of this project was to develop an intuitive, easy-to-use Dash application that enables ship owners to calculate annual compliance costs, total CO₂ emissions, taxable CO₂, and total fuel consumption. The goal was to provide ship owners with clear, actionable insights into their fuel emissions so they can better understand their environmental impact and prevent future compliance risks. During the initial release, the tool was fully public-facing to maximize visibility and drive traffic to the site. After gaining strong early traction, access to the application was transitioned to a login-based model, requiring users to register before using the tool. The platform reached over 45,000 users within its first month, demonstrating strong demand and engagement.
Design Approach
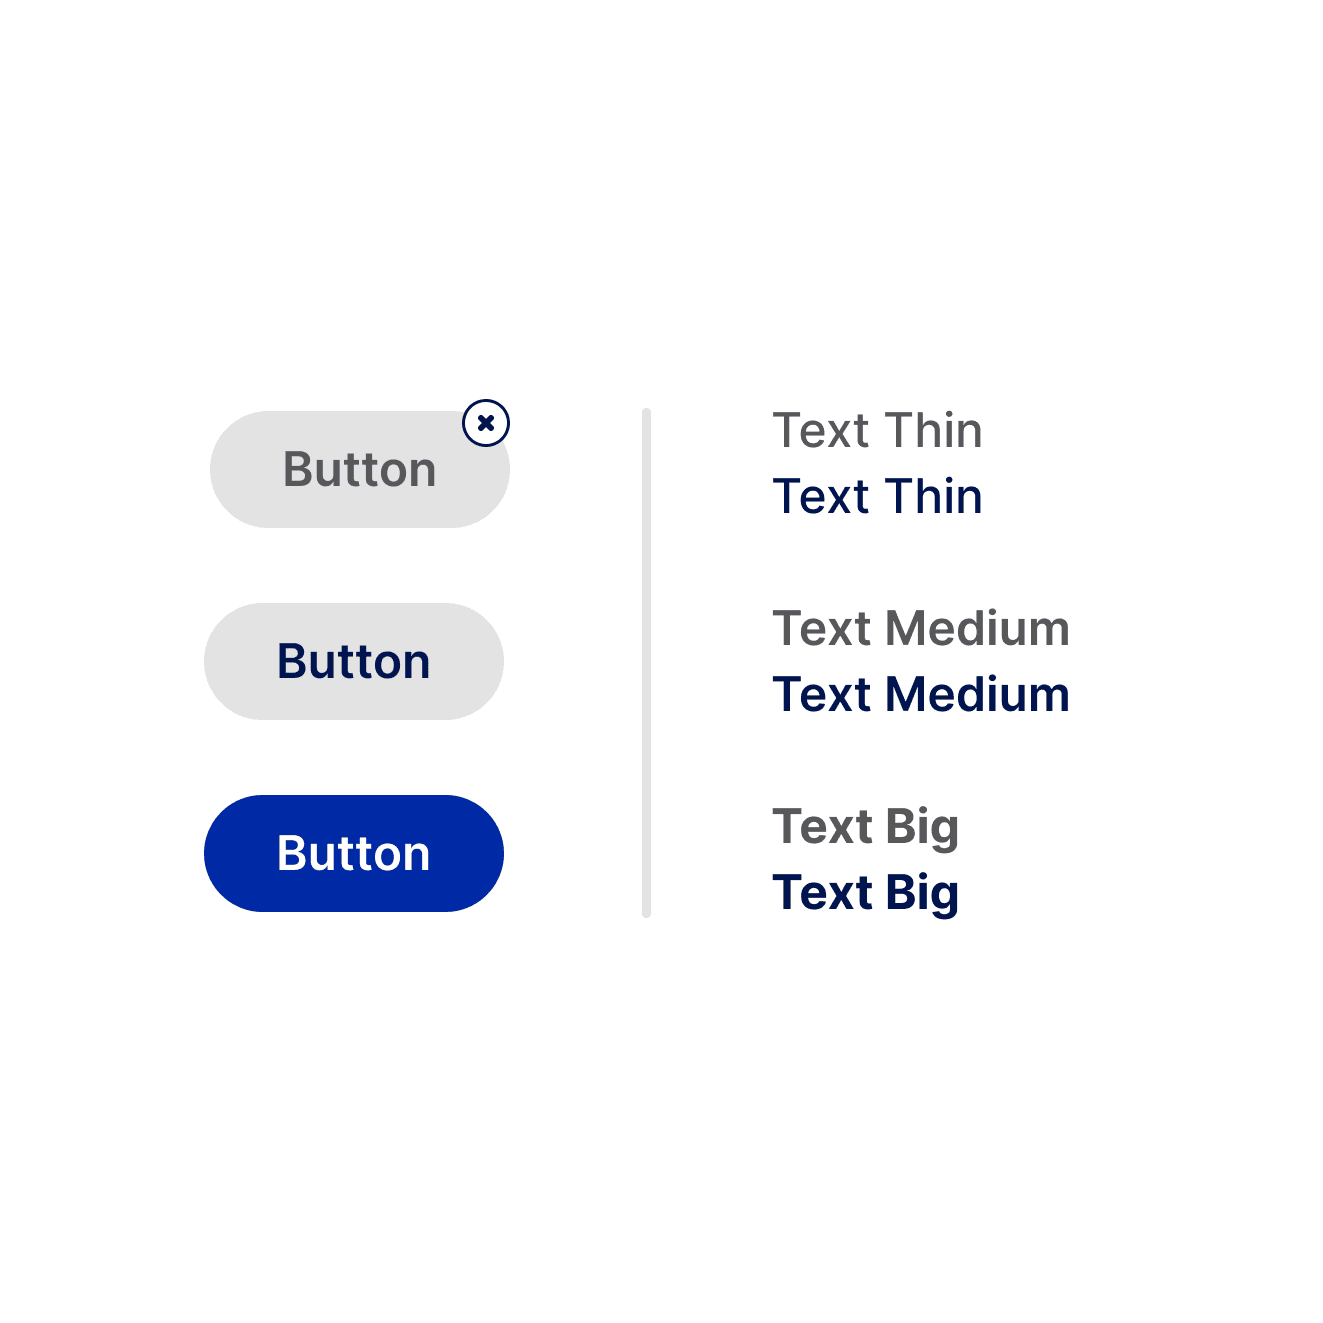
My approach to the design was to keep the site clean, organized, and easy to move through without feeling too rigid or overly formal. I used rounded, bubble-like shapes throughout the icons and headers to give the layout a softer and more welcoming feel. It helped make the site feel a little more personal while naturally guiding users through each section.
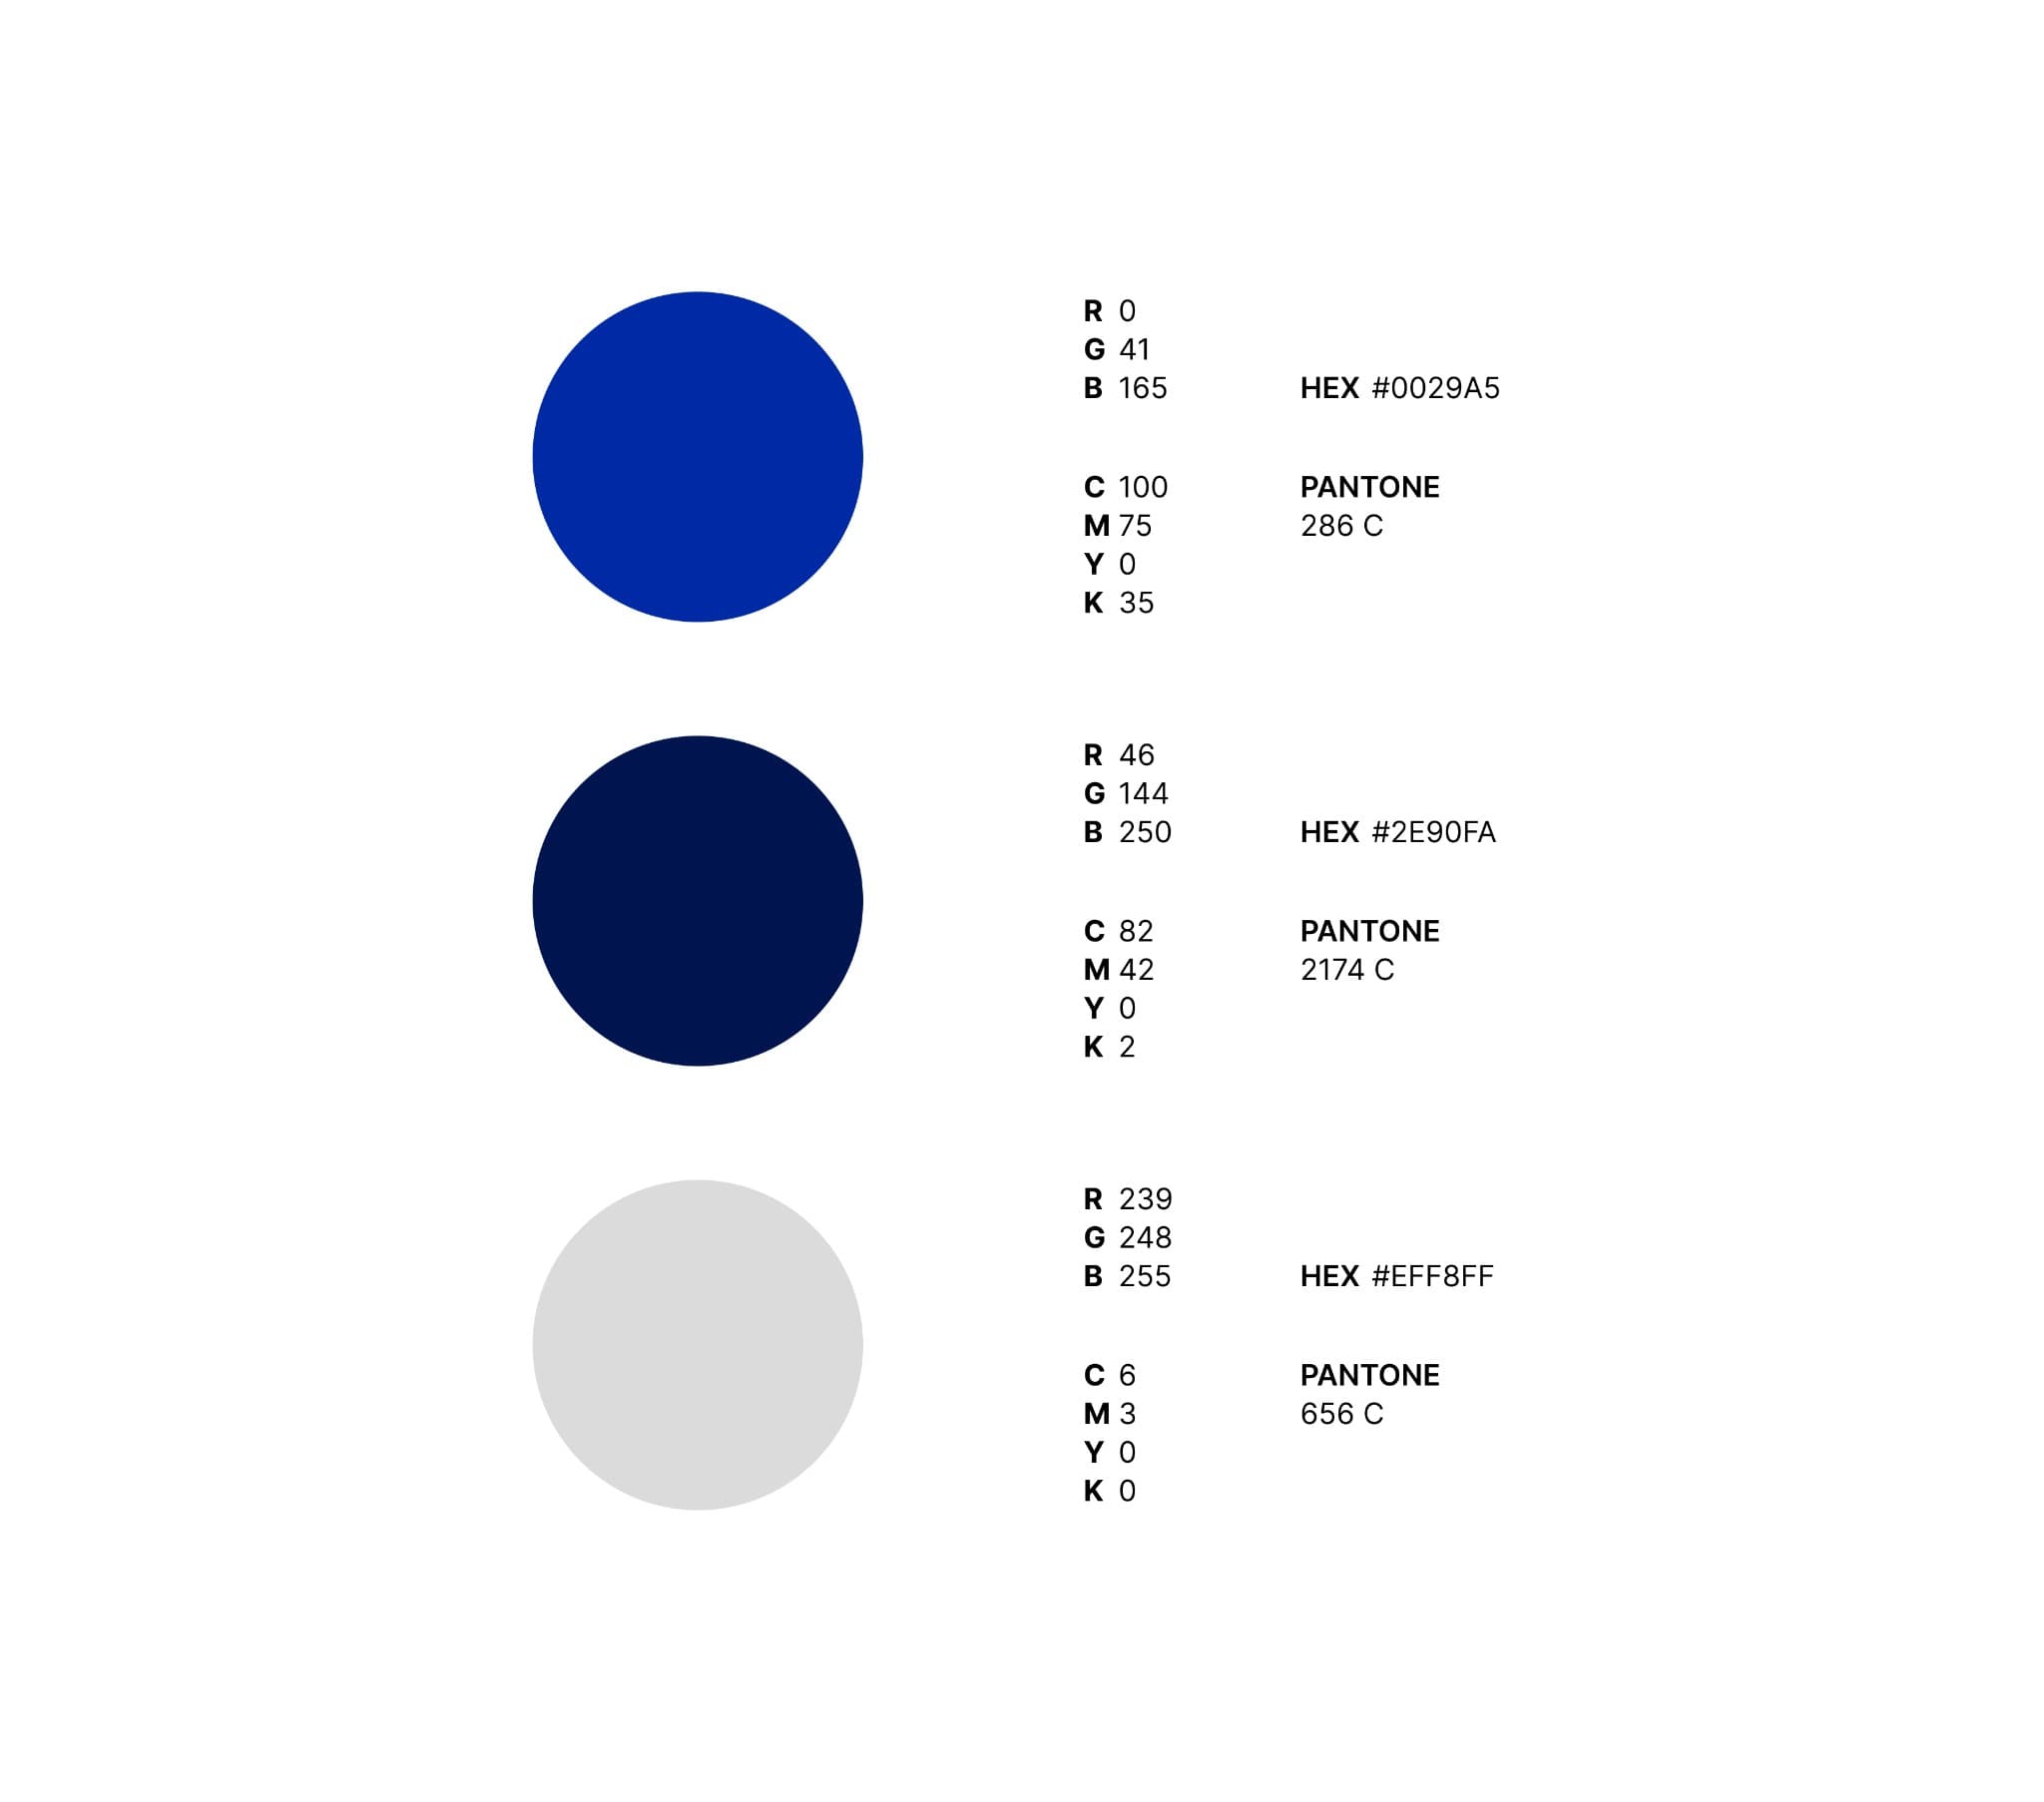
I also worked with different shades of blue to create contrast and structure across the page. Lighter tones help separate sections without adding clutter, while darker blues draw attention to important elements like headers and icons. The overall goal was to keep the interface modern and cohesive while still feeling simple and approachable.
Prototype Flow Explanation
The EU ETS Calculator is designed to guide users through a structured and intuitive process for estimating emissions-related costs for maritime vessels. The workflow emphasizes validation, flexibility for multi-ship input, and clear calculation outputs.
IMO Input & Validation
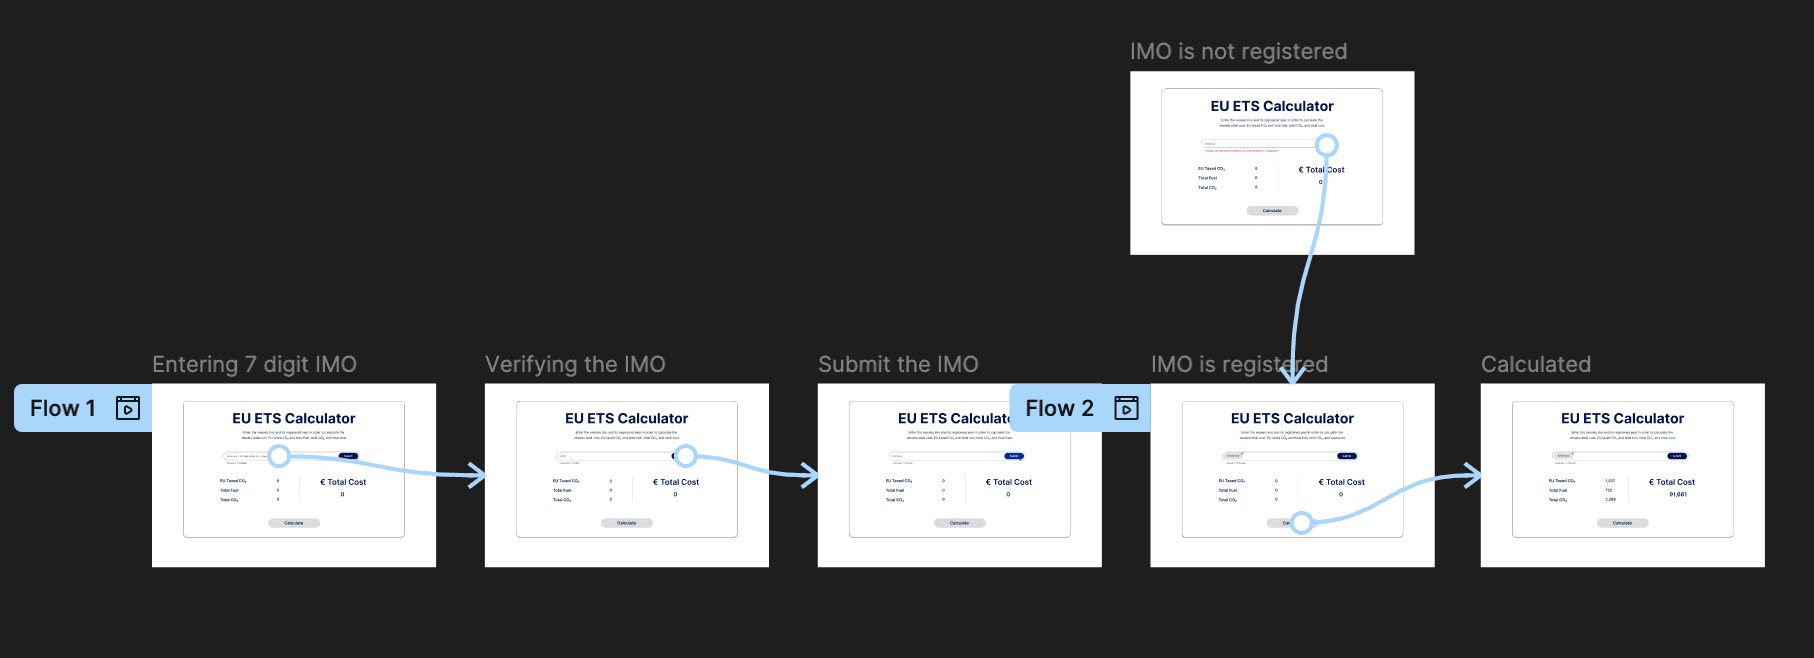
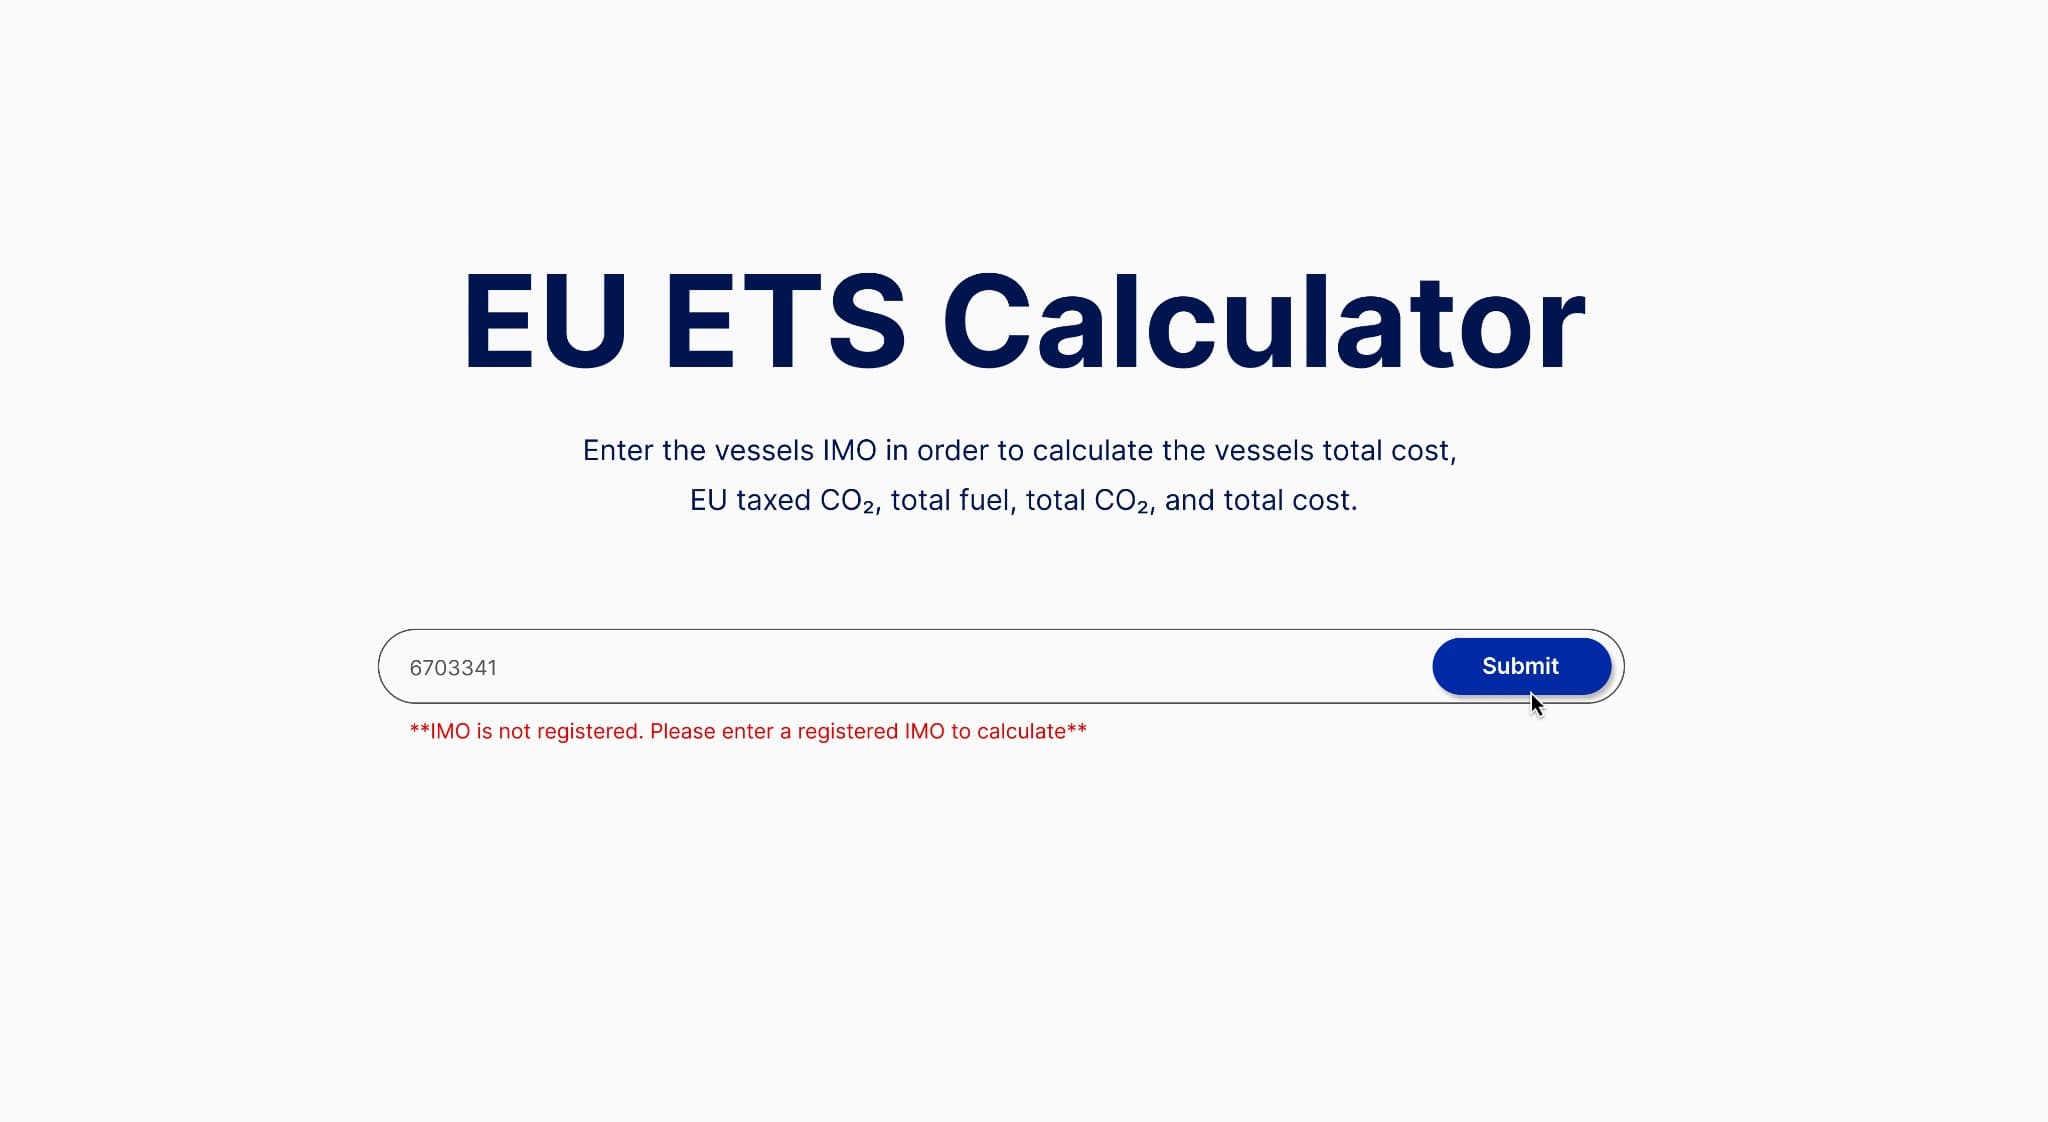
The user begins on the primary input screen, where they are prompted to enter a 7-digit IMO number (International Maritime Organization identifier), which uniquely corresponds to a registered vessel.
If the entered IMO is invalid (incorrect format or not found in the system), the interface immediately displays an error message, prompting the user to re-enter a valid number. This validation step ensures that only verified ships are processed, maintaining data integrity and calculation accuracy.
IMO Submission & Multi-Ship Entry
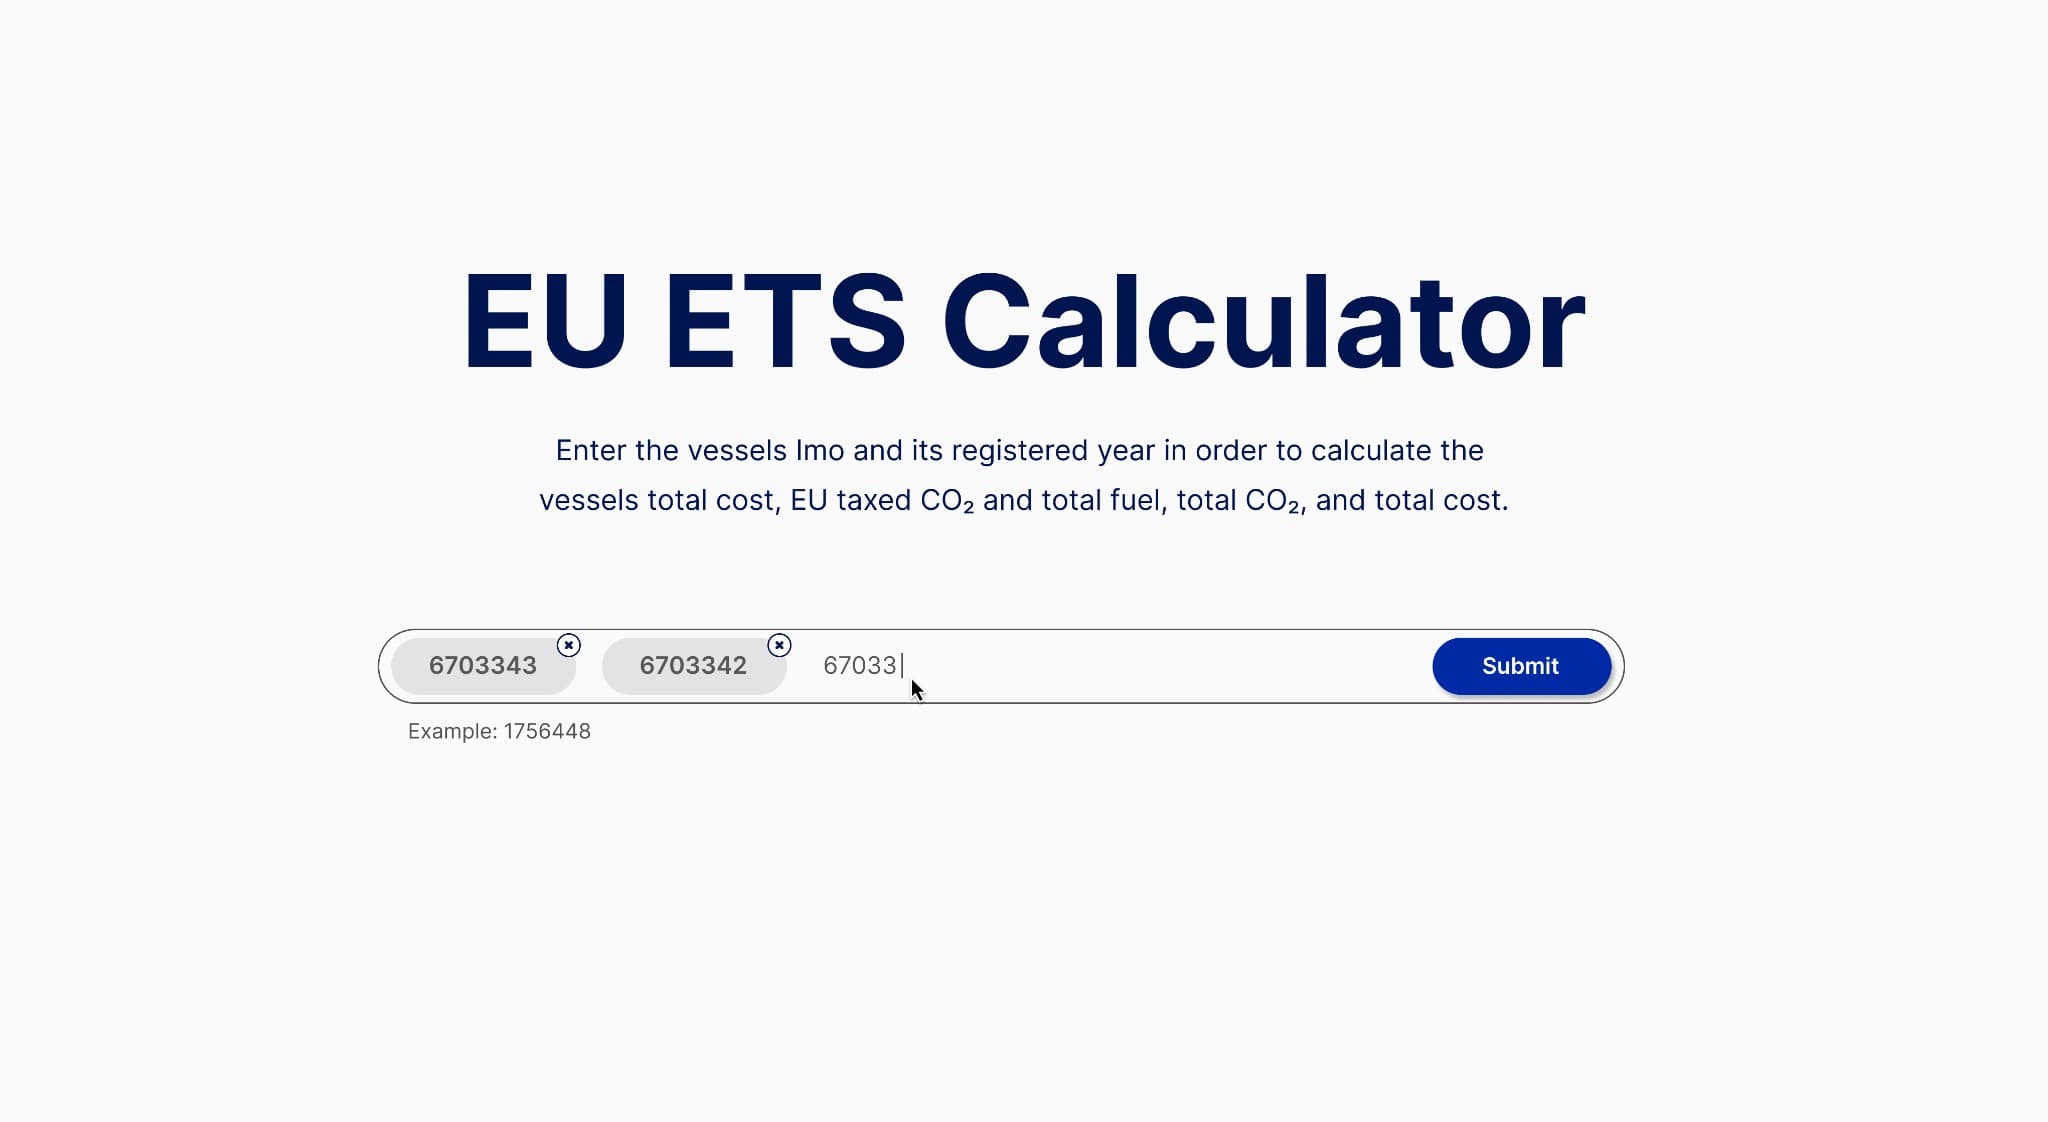
Once a valid IMO is entered, the user can click the “Submit” button.
- The submitted IMO is stored within the session, allowing users to build a list of vessels.
- Users can continue entering additional IMOs, making the tool scalable for ship owners managing multiple vessels.
- The interface supports iterative entry without forcing immediate calculation, improving usability for fleet-level analysis.
Output & Results Display
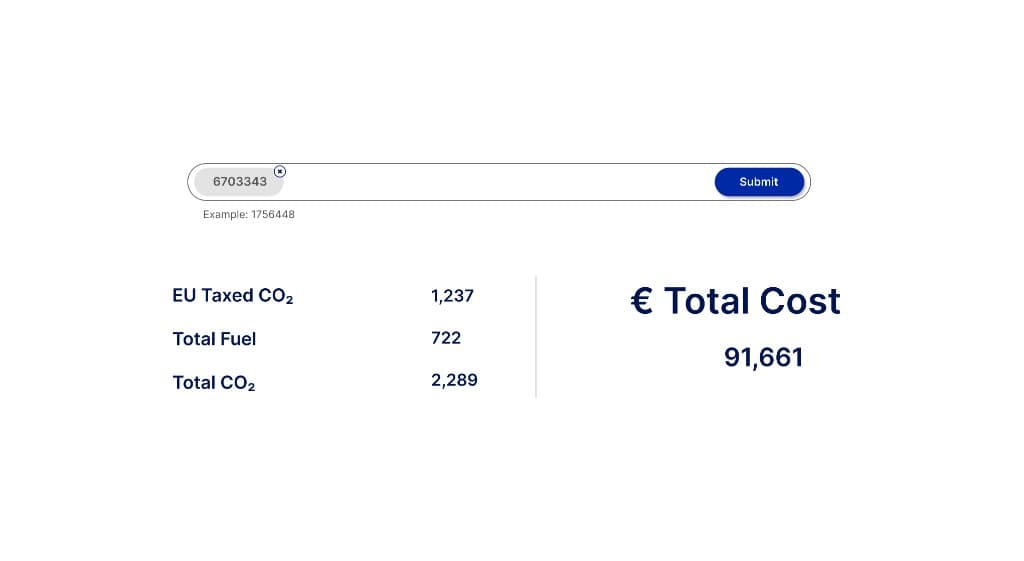
Upon calculation, the application returns key EU ETS metrics for the selected vessels:
- EU Taxed CO₂ Cost
- Total Fuel Consumption
- Total CO₂ Emissions (current year)
These outputs provide users with a clear understanding of their regulatory exposure and environmental impact, enabling informed operational and financial decisions.
Web Stack Explanation
The application was built using Dash, with a strong emphasis on creating a seamless and intuitive user experience. I led the entire front-end design process, developing wireframes and interactive prototypes to ensure complex emissions and compliance data could be presented in a clear, digestible way. The interface was structured around user-centered workflows, allowing ship owners to easily input data and instantly visualize fuel usage, total CO₂ output, and taxable emissions. As the product evolved from a public-facing tool to a login-based experience, the design was adapted to support user onboarding and conversion. The final result balanced analytical depth with simplicity, enabling high engagement and rapid adoption at scale.
Lessons Learned
This project reinforced how critical clarity is when designing tools for complex, data-heavy decisions. I learned to simplify technical EU ETS calculations into a guided flow that users could trust quickly, while still preserving analytical depth. It also highlighted the importance of close collaboration with engineering to align UI behavior, edge-case handling, and real-time calculation feedback so the final product felt both accurate and intuitive.
More work
A few other projects worth a look.